In an increasingly unpredictable financial world, knowing what major investors are doing can make the difference between reacting late or anticipating the next move. Two little-known indicators —the DIX and the GEX— help us read this hidden flow. You don’t need to be a Wall Street analyst to understand them; you just need to observe the market with a trained eye.
When you look at a stock or an index price, you’re only seeing the tip of the iceberg. Beneath the surface lie thousands of institutional trades that never go through public exchanges. Large funds, banks, and insurers often operate in spaces called dark pools —literally “dark swimming pools”— where they can buy or sell massive volumes without the market noticing immediately.
These parallel spaces help avoid sharp price swings, but they also reveal the true institutional sentiment: that’s where the big players make their move before anyone else sees it.
To measure what’s happening there, the company SqueezeMetrics created the DIX, or Dark Index. This indicator shows whether institutions are buying or selling inside these opaque markets.
The DIX: the footprint of big money in the dark
Imagine you’re in a supermarket. In the public area, people are shopping as usual. But there’s a door in the back where loaded carts roll out —that’s the big buyers’ zone. The DIX tells us whether those carts are full or empty. In other words:
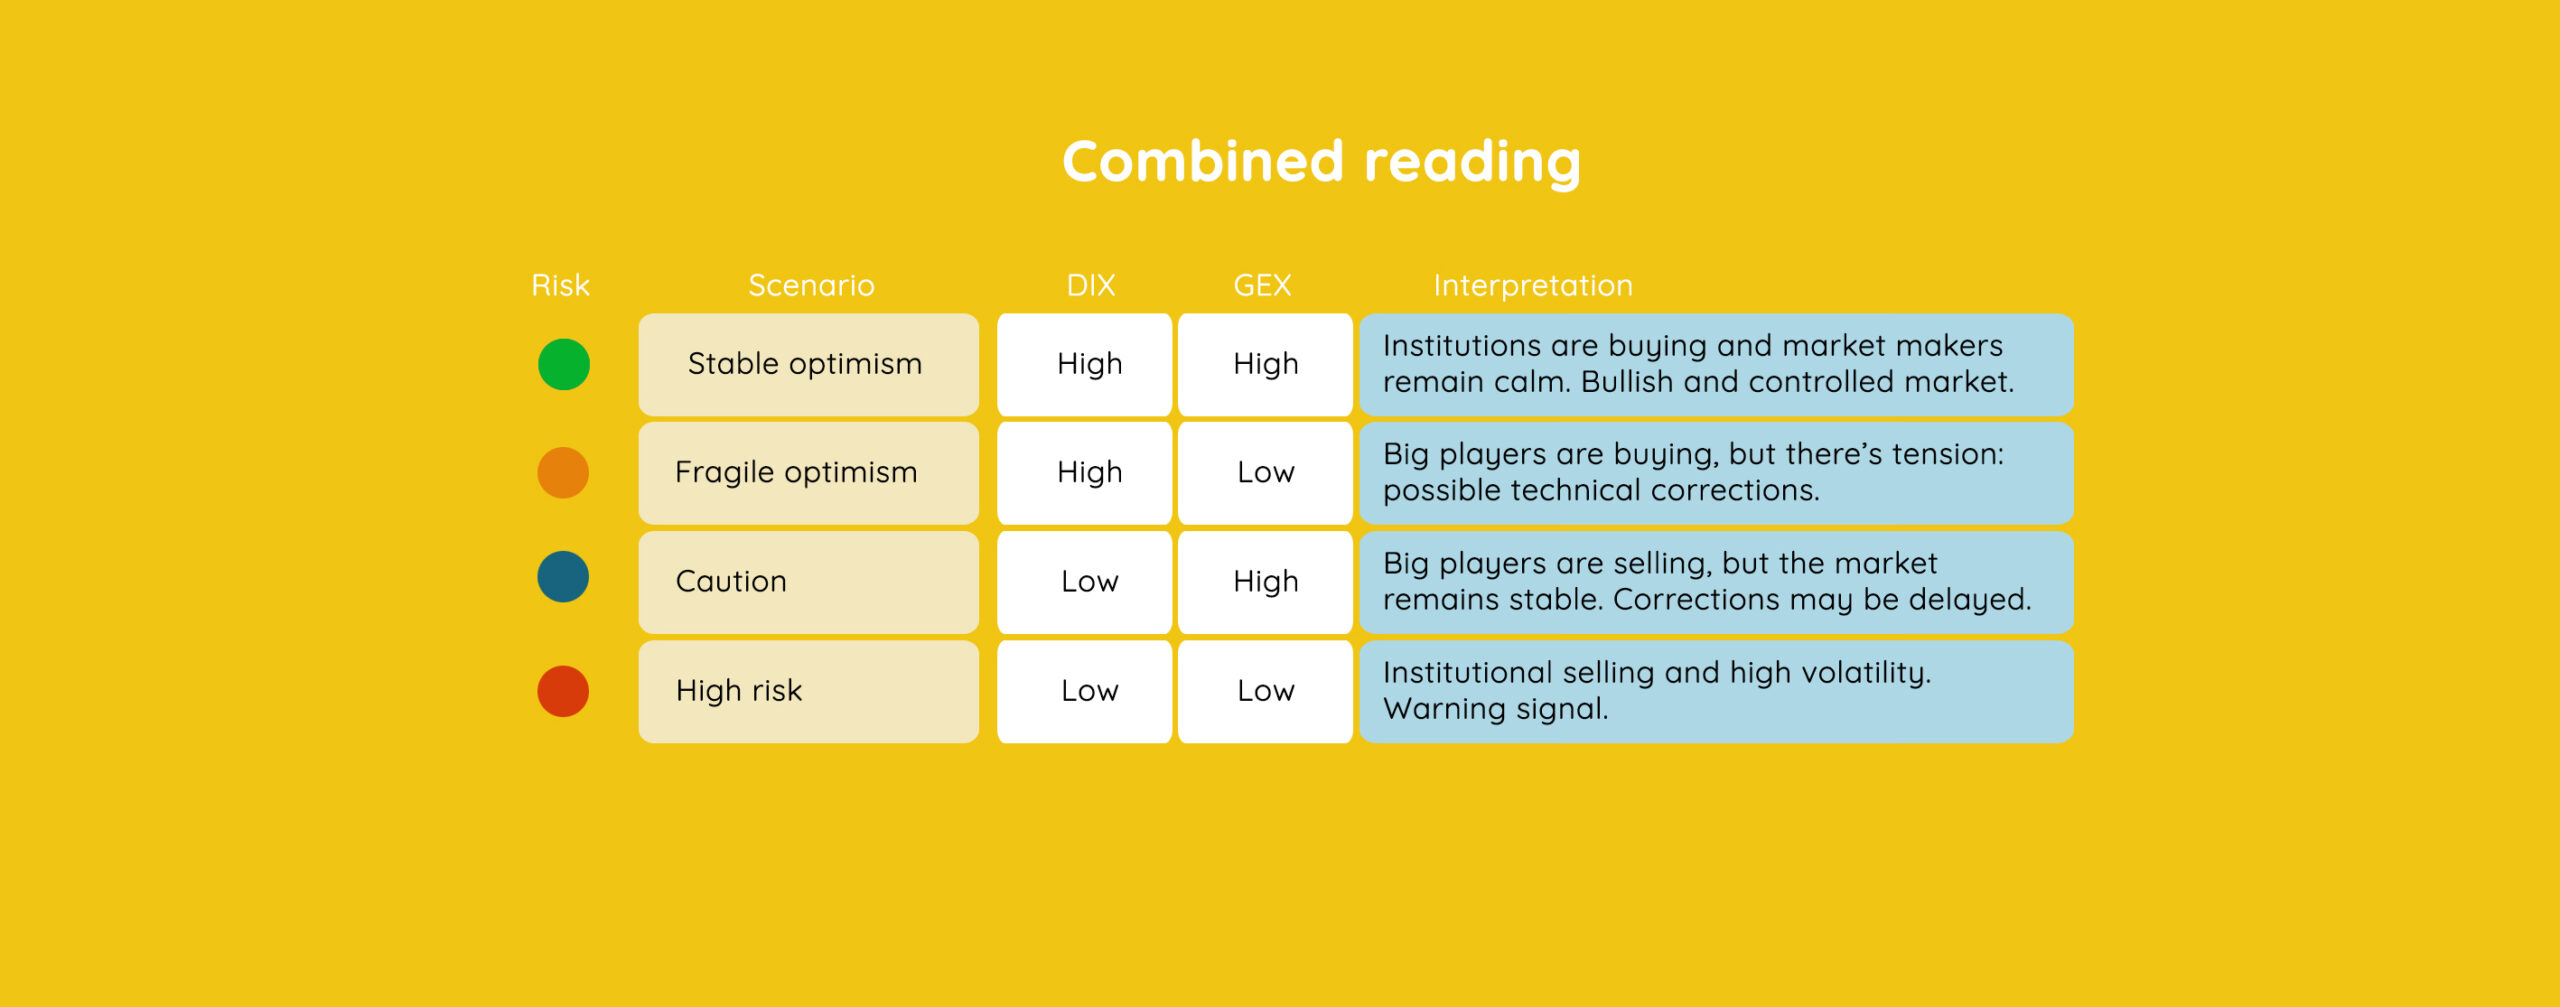
- A high DIX (above 45%) means net institutional buying. The big players are quietly accumulating shares —a signal of optimism, buying now what they believe will be worth more tomorrow.
- A low DIX (below 40%) means net selling. The big players are reducing exposure or taking profits, often before a correction.
This indicator doesn’t tell us when the market will move, but it does show who is moving —and in which direction. When institutional money flows in, markets usually rise in the following weeks. When it flows out, turbulence often follows.
The GEX: the temperature of volatility
If the DIX tells us what is happening, the GEX —Gamma Exposure— tells us how. Here we look at market makers, the intermediaries who provide liquidity to the options market, particularly around the S&P 500.
These professionals use a strategy called delta hedging to manage risk. Depending on the volume of call and put options, they adjust their positions. The GEX measures how much those adjustments might cushion or amplify market moves. Thus:
- A high GEX means stability —market makers are acting as shock absorbers, damping volatility.
- A low or negative GEX means tension —their adjustments amplify each move, making the market nervous, like a taut string that can snap on any news.
Put simply: the GEX is the emotional thermometer of the market. When it rises, there’s calm. When it drops, there’s fear.
Combining DIX and GEX: an institutional compass
No single indicator is perfect, but together they offer a much richer view. The DIX shows what institutional money —funds, insurers, banks, and pension managers— is doing, while the GEX shows how the market might react. For example, many professional managers read them together as a combined signal of sentiment and risk.
There is no need to guess the future, just interpret the present with context.
A real example: March 2020
During the first weeks of the pandemic, the DIX plunged while the GEX turned negative. Institutions were selling, market makers were amplifying the moves, and the result was one of the fastest market crashes in history.
By late March, the DIX started rising again as the GEX recovered —and the market began its spectacular rebound. This combination signaled the trend reversal days before most retail investors noticed. You might not have a research team or an algorithm tracking institutional flows, but understanding these indicators helps you read the market’s emotions more clearly.
Knowing when “smart money” flows in or out is like having a weather map: it doesn’t stop the storm, but it helps you decide whether to carry an umbrella.
The term refers to large professional investors —banks, hedge funds, insurers, or public institutions— with access to superior information, tools, and analytical capacity compared to retail investors. They’re often the first to detect economic cycle shifts or market turning points, and their capital flows can foreshadow what the rest of the market will do later.
Following the trail of smart money isn’t about imitation —it’s about interpreting the market’s true sentiment. If these institutions quietly accumulate positions, they’re probably expecting better times. If they’re reducing exposure, a storm may be coming. The goal isn’t to predict the future, but to read the signals left by those who move the most influential capital.
Moreover, DIX and GEX remind us of a fundamental lesson: markets move not just on data or news, but on collective behavior —of investors, institutions, and intermediaries. Understanding that behavior is key to investing with reason rather than emotion.
Seeing behind the market’s curtain
The financial world frequently looks like a chess match between giants. But even small players can watch the board and understand the moves. Indicators like DIX and GEX let us glimpse the hidden institutional dynamics —the forces that move prices but rarely make headlines.
They’re not magic tools or instant trading systems, but they help interpret trends and measure risk. Used wisely, they let us act with more logic and less emotion —and in finance, that’s a major advantage.
Markets don’t reward those who guess —they reward those who understand. DIX and GEX aren’t crystal balls, but they are windows that let us peek behind the curtain of big capital. Learning to read them is learning to read human behaviour in its purest form: fear, greed, and confidence.
If you want to discover the best option to protect your savings, enter Preciosos 11Onze. We will help you buy at the best price the safe-haven asset par excellence: physical gold.